




 En
En  Português
 Svenska
 Türkçe
 Română
 Polski
 Français
 Español
 Deutsch
 Dansk
Dansk Suomi
Suomi Norsk Nynorsk
 Lietuviškai
 Magyar
 Ελληνικά
 日本語
日本語 Русский
 中文 (中国)
 Tiếng Việt
 Italiano
 Čeština
 Nederlands
 العربية


 Bitcoin
 Ethereum

bl
blood, sweat, and tears
 CA
CA
Squad
No squad information available.
Statistics
| Stats | Value | Avg | Overall avg |
|---|---|---|---|
| Score | 47.4% | 44.4% | 37.1% |
| Kills | 2,470 | 91.5 | 76.1 |
| Headshots | 1,277 | 47.3 | 37.1 |
| Death | 2,529 | 93.7 | 83.4 |
| Open kills | 7 | 0.01 | -0.06 |
| Kill cost | -59 | -2.2 | -7.3 |
Upcoming matches
No upcoming matches or tournaments scheduled.
Match history
No matches found.
Maps
| Stats | Winrate | Count | Last 5 maps | P | B | CT Winrate | T Winrate |
|---|---|---|---|---|---|---|---|
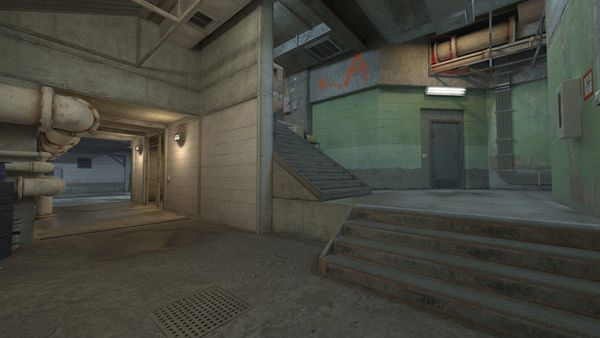 |
42.9%
|
7 |
W
–
–
–
–
|
0 | 0 | 47% | 50% |
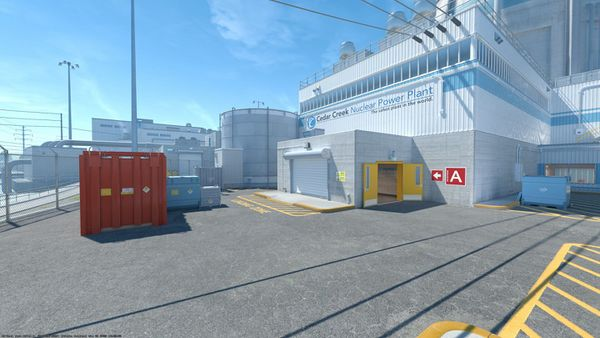 |
50%
|
6 |
L
–
–
–
–
|
0 | 0 | 52% | 42% |
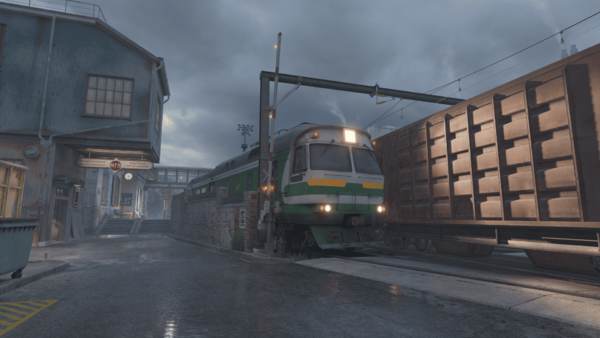 |
50%
|
4 |
W
–
–
–
–
|
0 | 0 | 64% | 28% |
 |
25%
|
4 |
L
–
–
–
–
|
0 | 0 | 39% | 53% |
 |
33.3%
|
3 |
–
–
–
–
–
|
0 | 0 | 54% | 43% |
 |
66.7%
|
3 |
W
–
–
–
–
|
0 | 0 | 47% | 56% |
Betting




FAQs
What is the win rate for blood, sweat, and tears in CS2?

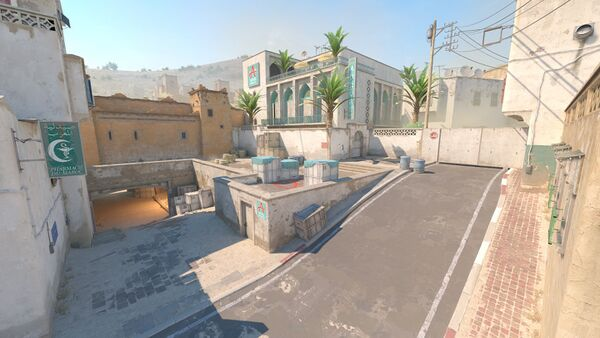
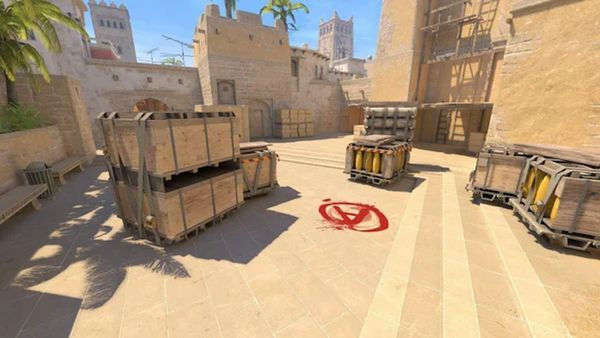
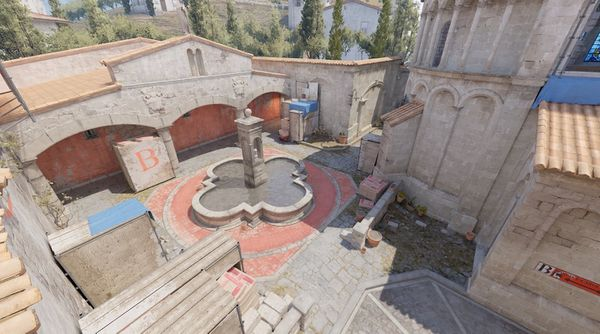
blood, sweat, and tears has a 47.4% win rate with a 9-10 record across 19 matches (available completed match history). The strongest maps in that sample are Inferno (66.7%, 3 maps), Nuke (50%, 6 maps), Train (50%, 4 maps), while Dust2 is the lowest win-rate map at 25%.
Which maps does blood, sweat, and tears play best in CS2?
The strongest maps for blood, sweat, and tears in the available completed match history are Inferno (66.7%, 3 maps), Nuke (50%, 6 maps), Train (50%, 4 maps). The most-played map in that sample is Overpass.
What is the weakest CS2 map for blood, sweat, and tears?
The lowest win-rate map for blood, sweat, and tears in the available completed match history is Dust2 at 25%.
How experienced is blood, sweat, and tears in CS2 match history?
blood, sweat, and tears has 19 matches (available completed match history), with a 9-10 record and a 47.4% win rate.